In an attempt to figure out what the hell has been going on at Texas institutions lately, I’ve been playing around with some numbers. Since the contemporary arts organizations I wanted to look at—Arthouse, The Dallas Contemporary and the Contemporary Arts Museum, Houston—don’t publish their annual reports online, I turned to their Form 990s. Form 990s provide incomplete information, but I’ve done my best.
This first article in a series of three will deal with both Arthouse and The Contemporary, since they both went through major expansions over the past few years and are of a similar size (measured in terms of assets). Given the recent announcement of “merger talks” between Arthouse and The Austin Museum of Art, Arthouse gets a bit more attention.
The next article will look at The Austin Museum of Art. AMoA wasn’t in my initial set when I conceived of this series, but the potential merger made it critical to include. The final article will turn to the CAMH. I initially conceived of the series before the Arthouse-AMoA announcement and planned to focus on Arthouse, The Contemporary, and CAMH in order to cover a large contemporary art space in each major Texas city. When the merger announcement was made, AMoA became important to consider as well. In each article, I select other organizations outside Texas to provide comparison cases. (For Part I, it is the San Jose Institute of Contemporary Art.) These organizations are selected on the basis of mission, size and the type of community in which they are located.
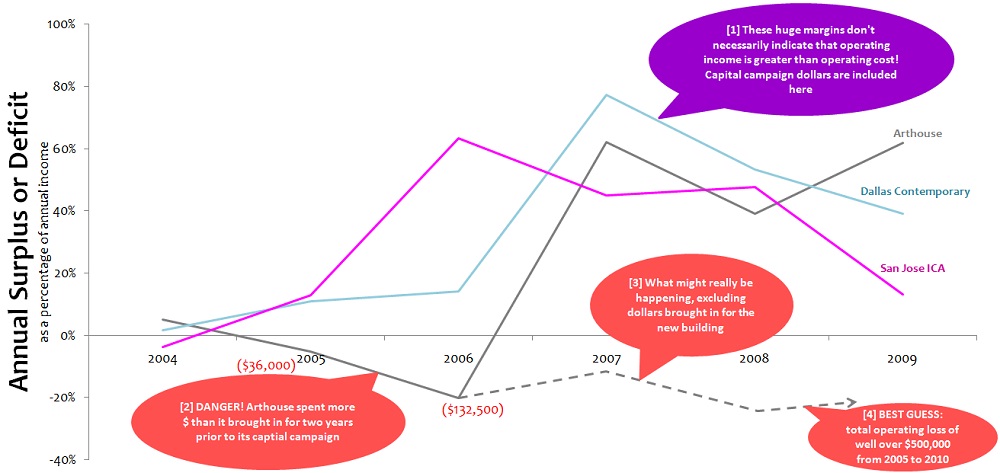
If you only look at one graph in this article, I want it to be the first one. The figure shows the annual surplus or deficit run by each organization—Arthouse, The Dallas Contemporary and the San Jose Institute of Contemporary Art—from 2004 to 2009. (Most organizations don’t have 2010 numbers up on GuideStar.org yet.)
The surplus/deficit graph is most important because it suggests that Arthouse isn’t being totally transparent about the reasons for the dire financial straits in which it presently finds itself. Even before its expansion, it was running an operating deficit. Most likely, even though it brought in tons of money for the expansion from 2007 – 2009, it was still running an operating deficit in these years. In other words, it probably continued to bring in less money for programs and administration than it spent on programs and administration.
To me, this is a bigger deal than a capital campaign shortfall, because it means that the board and the director were not properly overseeing the budget. Either way, Arthouse’s leadership needs to come forward and tell us what went wrong and, more importantly, why it isn’t going to happen again.
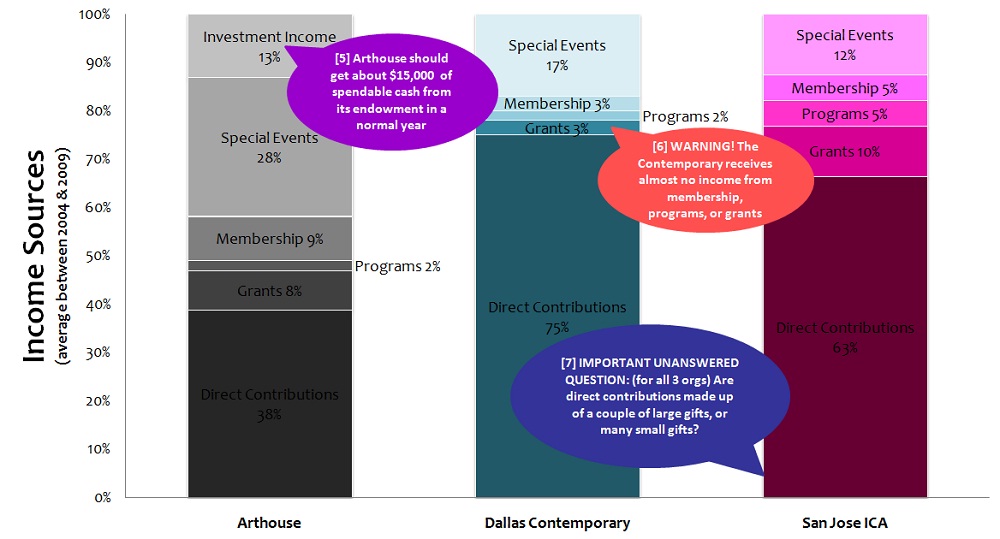
If you look at only two graphs, I want the second to be figure two on income sources. You will see that memberships have made up 9% of Arthouse’s income over the past six years. If you are a member, you should have a significant voice in the organization. Use it.
Financial stability is the central term upon which the future of Texas contemporary arts organizations is being discussed right now. I intend the following set of figures and corresponding notes as a resource in this respect for all of those invested in the Arthouse (and Dallas Contemporary) communities. However, money and numbers aren’t everything. Mission, vision and quality of execution are critical aspects of arts organizations’ performance, too. The Statesman recently quoted collector and art patron Mickey Klein on the potential Arthouse/AMoA merger:
“I think it’s a natural. We’re in a small city with a limited base of donors for the arts, and we’re all after the same dollar, which is diminishing. We don’t need competition. We need collaboration.”
Klein is right, it is a financial natural. But it is not an artistic natural, and art, not money, is the mission of both organizations. The two organizations do not serve the same communities (though there is overlap) and they do not show the same kind of work. This doesn’t necessarily mean a merger isn’t a good idea. It means serious sacrifices will be made. Who will make those sacrifices? We need to know. Again, the leadership of both organizations needs to come forward and be clear about what will be lost and what will be gained.
We need more information than can be gleaned from 990s to really understand each of the institutions discussed. Finances are only one piece of the puzzle, and the information from 990s discussed here is imperfect. Still, it’s a starting place.
The first figure below shows annual surplus or deficit as a percentage of annual income. For example, in 2004, Arthouse’s annual income was $630,000 and its annual expenses were $599,000. Thus, its surplus was $31,000, or 5% of its annual income.
[1] 990-reported income and expense figures don’t account separately for money that funds operations and money that funds a new building. So, when the organizations start raising money for their new buildings, it suddenly looks like they have huge surpluses. Internally (and in their annual reports), organizations should keep track of money for operations and expansion separately. If they don’t, they run the risk of spending money meant for the expansion to fund an operating deficit. When the big money for the expansion stops rolling in, they find they basically have negative money.
[2] The best indicator we have for what Arthouse’s purely operating surplus/deficit was during the capital campaign years is what it was the years immediately prior to the campaign. We’re looking at losses of $36,000 and $132,000 in 2005 and 2006, respectively.
[3] Since the organization doubled the size of its staff between 2006 and 2010, the kinds of operating deficits we see in 2005 and 2006 must have persisted, and probably even grew.
[4] I’d put my money on an operating loss of over $750,000 between 2005 and 2010—that’s what it would be if the 2006 loss ($132,500) was representative of future years’ losses. A very conservative estimate would take the average of the losses in 2005 and 2006 for a total loss of $500,000 between 2005 and 2010.
Figure 1
Figure 2
Figure 2 shows the proportion of funding that comes to the organization from each source. It’s a six-year average. For example, between 2004 and 2009, 9% of the organization’s income came from memberships.
[5] The value of Arthouse’s endowment-equivalent (reported as “permanently restricted net assets” in its 990s) ranged from $260,000 in 2004 up to $340,000 in 2007 and, because of the financial crisis, was down to $230,000 in 2009. Since then, it has probably rebounded a bit. Institutions usually withdraw about 5% of the value of their endowment each year. The idea is that investments grow at an average of about 7% per year, 2% of which is inflation. By withdrawing only 5% of its endowment’s value, an organization can preserve the real value (the buying power) of the endowment and future income from it. Applied to Arthouse’s endowment—let’s call it $300,000—a 5% spending rule would yield about $15,000 in income annually.
[6] Very little of the Dallas Contemporary’s funding comes from sources other than direct contributions. On the positive side, this could give the organization freedom from the restrictions and requirements than come attached to grant money, for instance. On the negative side, diversification of funding sources could help protect the organization against changes in how much donors give from year to year.
[7] The information available in 990s does not answer an important question about funding sources: how diverse is the donor pool? Are direct contributions made up of a couple of huge gifts or many smaller gifts? How dependent is the organization on any one given donor?
Figure 3
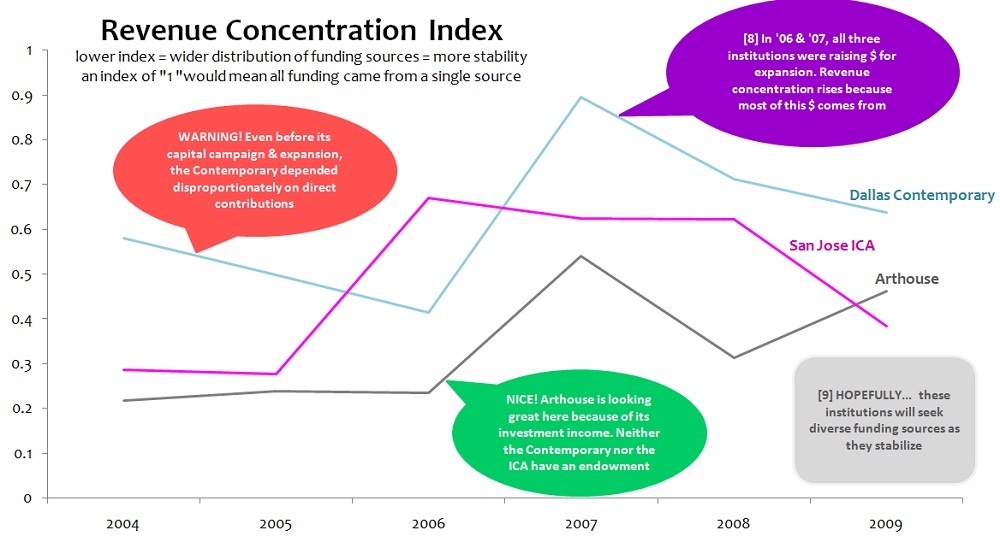
Figure 3, the “revenue concentration index” is a number that summarizes the diversification of an organization’s income sources. (Don’t read this parenthetical if you don’t care about the math. It’s the sum of the squares of the ratios of each income source to total income.) An index of “1” would mean all income came from a single source. The lower the index, the greater the diversification of income sources is.
[8] In 2006 and 2007, the revenue concentration shoots up for all three institutions. This is because they’re capital-campaigning for their expansions. Suddenly, they’re bringing in bigger direct contributions, and these contributions dwarf the size of their other income sources. This is fine—it’s just what happens when you bring in big gifts for a building project.
[9] The question is whether these organizations can return to a more balanced funding mix in the years ahead. Have they planned ahead to increase funding from all sources in line with their facilities expansions?
Figure 4
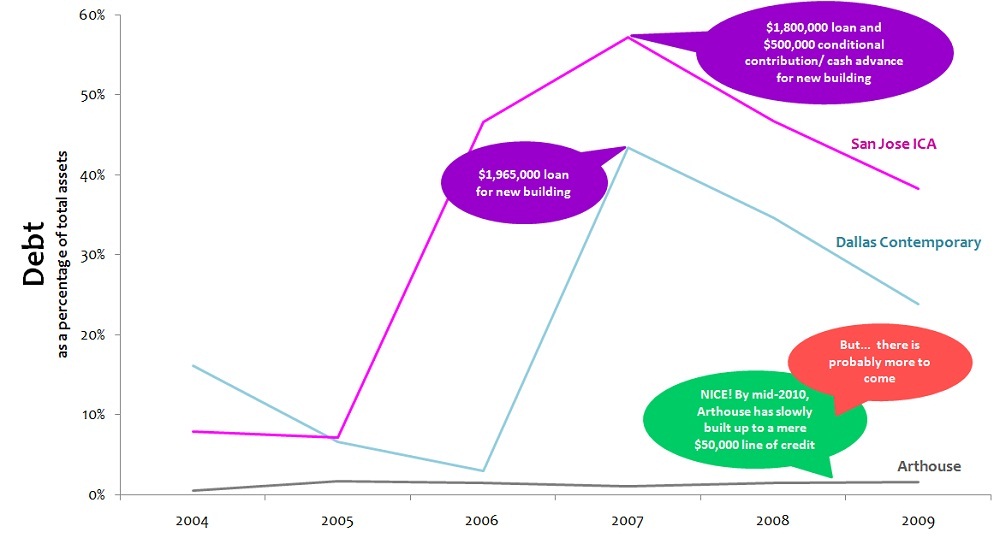
Figure 4 shows debt as a percentage of total assets. What’s interesting here is how little debt Arthouse has taken on to fund expansion compared to the other two organizations. Is it because the big debt doesn’t appear until 2010 and 2011? Or has Arthouse simply been extremely conservative in its approach to debt obligations? On the other hand, the San Jose ICA, which took on debt worth almost 60% of its total assets in 2007, certainly went out on a limb in the other direction.
Figure 5
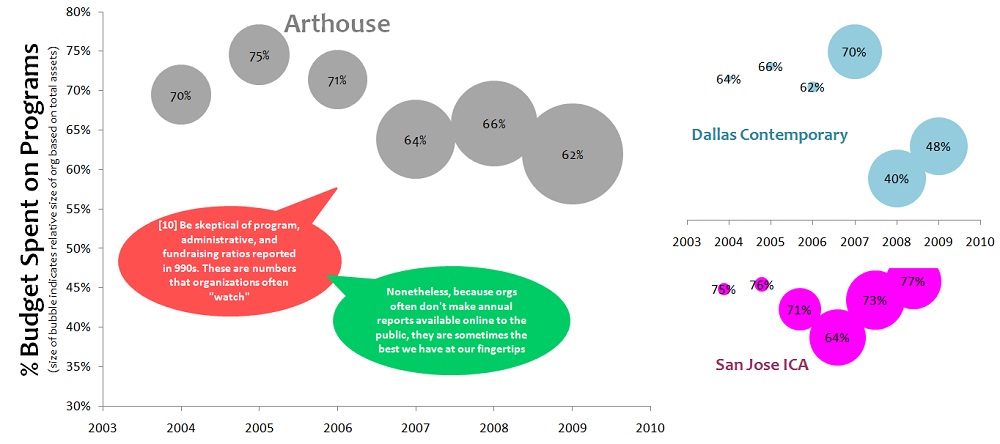
Figure 5 shows the percent of the budget spent on programs each year. The size of the bubble indicates the relative size of the organization, measured in total assets.
[10] Watchdog organizations often look at this number—the “program ratio”—in their assessments of nonprofits’ financial effectiveness and efficiency. Unfortunately, these numbers don’t always mean that much for two reasons. First, organizations that haven’t kept careful track of their accounts often just make (more-or-less educated) guesses about how much of the money they spent went to programs, administration and fundraising. Second, organizations know that funders (rightly or wrongly) don’t like to see too many dollars going to “overhead.” For this reason, it’s by no means unheard of for organizations to fudge the program and administration expense numbers in order to make it look like they’re spending less on administration than they actually are.
Claire Ruud has an M.A. in art history from The University of Texas at Austin and is pursuing an M.B.A. at The Yale University School of Management. She thinks a lot about feminism, queer theory, and financing contemporary art production.



1 comment
I think the Dallas Contemp percent of budget numbers are skewed for 2008-2009. Moving spaces, looking for a new director, etc. meant they weren’t really running a full load of programming (plus the decline in debt suggests that they were taking advantage of the limbo period to cool the engines and pay down debt service). It will be interesting to see how the numbers look after the first year or two under Doroshenko.