SMU DataArts.
According to its sixth annual Arts Vibrancy Index, SMU DataArts, a national center for arts research at Southern Methodist University, has listed only one Texas city, Round Rock (North of Austin) on its Top 40 roster of the most arts-vibrant communities in the United States. Out of 900 cities in the U.S., Austin-Round Rock ranks at number 18, and has frequently appeared on the list in previous years.
The Index statement about Austin/Round Rock acknowledges Austin’s robust live music and filmmaking scenes, but delves deeper into how the Texas city made it to the list:
Despite Austin being the 11th largest city in the nation, the majority of arts organizations are small; however, the dynamism of the city’s arts organizations is reflected in the attraction of high numbers of state and federal government grants. Austin ranks in the top 3% of communities on Government Support, and within the top 5% on three out of four sub-measures. Austin’s high ranking in these measures is not surprising; Austin is home to several statewide arts organizations, making it a hub for arts leadership in the state. These organizations include the Texas Cultural Trust, Texans for the Arts, Texas Commission on the Arts, Center for Educator Development in the Fine Arts, and Texas Music Educators Association. The Cultural Arts Division of the city’s Economic Development Department provides leadership and management for Austin’s cultural arts programs and for the economic development of arts and cultural industries. With its strength in technology, Austin has achieved the distinction of being the first (and only) city in the U.S. to receive a City of Media Arts designation within UNESCO’s Creative Cities Network.

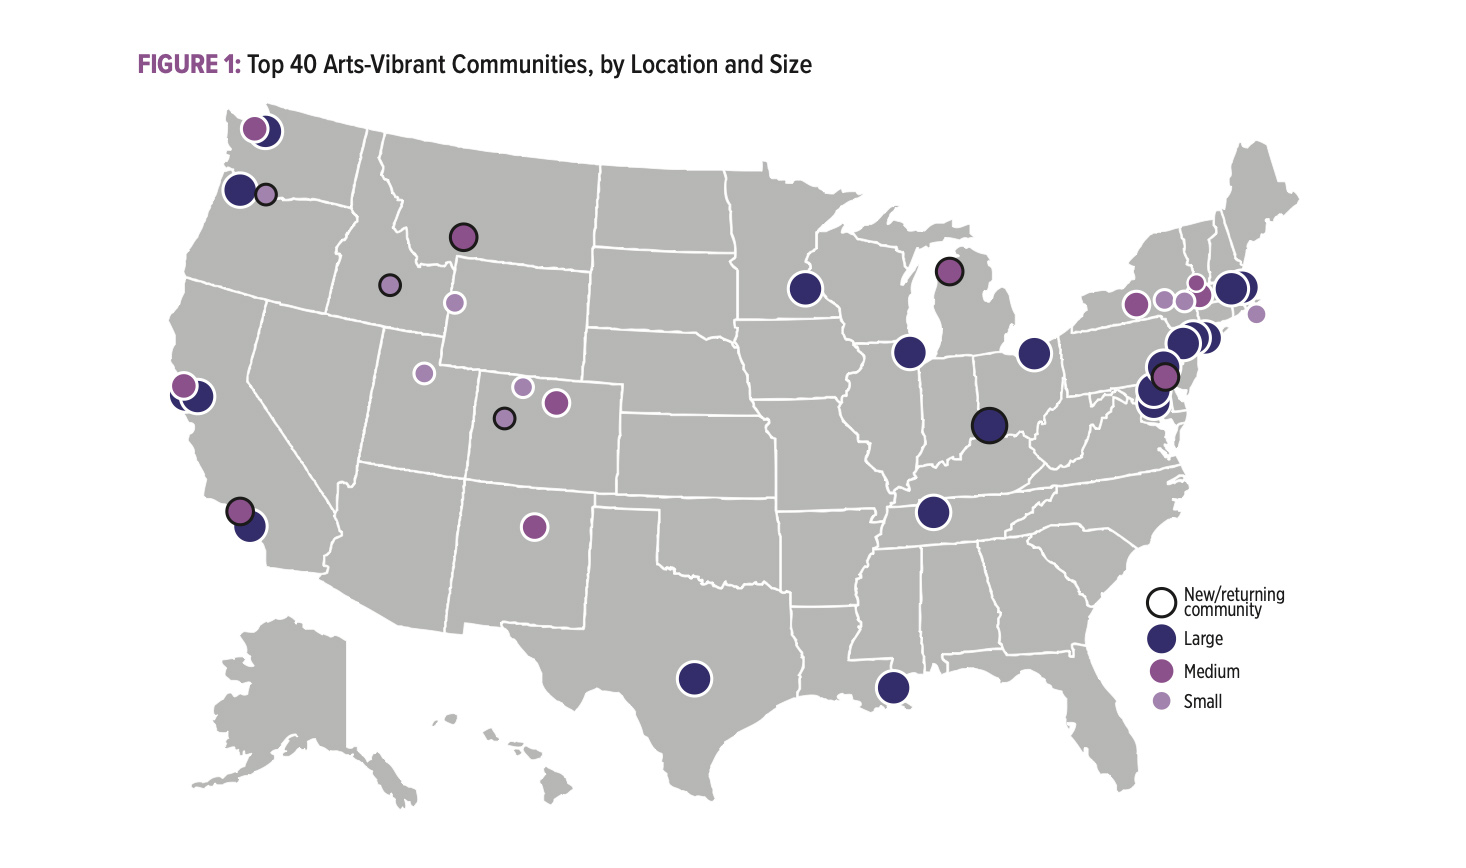
SMU DataArts Arts Vibrant Communities map, 2020.
The Arts Vibrancy index looks at how much supply, demand, and government support is present in each of the 900 cities. This metric gives arts leaders, businesses, government agencies, and others the ability to see how their communities support art. The list of 40 most arts-vibrant cities in the U.S. is broken down into the top 20 large cities, along with the top 10 medium and top 10 small communities. Four new communities appear for the first time in 2020, and another four make a comeback after an absence of at least a year.
Cincinnati, OH-KY-IN, has made it to the list for the first time and ranks 20 on the list, while Wilmington, DE-MD-NJ, and Oxnard-Thousand Oaks-Ventura, CA, numbers 6 and 8 respectively, make their debut on the list in the medium-sized cities. Bozeman, MT (no. 6), and Traverse City, MI (no. 10) return to the list in the medium-sized cities category, as well as Hood River, OR (10), and Glenwood Springs, CO (5), which return to being ranked among the small cities on the list.
The report, based on pre-Coronavirus 2019 data, “illustrate[s] the critical role of the arts, both socially and economically, in cities and towns around the nation.” The report continues: “At this historic moment, the report also serves as a pre-pandemic benchmark of where the most arts-vibrant communities are located.”
The 2020 Arts Vibrancy Index reports the following conclusions:
-The components of arts vibrancy are unique to each community. Some of the top communities have mostly small and mid-sized arts organizations and venues, while others have a concentration of large organizations and little else. Some benefit from close proximity and ties to another arts-vibrant community, while others are artist magnets or tourist destinations. Numerous arts sectors flourish in some communities, while a particular art form dominates in others.
-Every region of the country has vibrant arts communities. Large metropolitan areas are represented throughout the nation. This year, medium communities on the list also represent regions across the country, though are chiefly in the West, while small communities are predominantly in the West and Northeast.
-Very large cities showcase vibrancy through extensive dispersion or high concentrations of arts and culture. Some feature a strong concentration of arts vibrancy in the urban core with less going on in the surrounding areas (e.g. Chicago), while others feature vibrancy distributed evenly throughout the larger metropolitan area (e.g. San Francisco, Oakland-Berkeley, and San Rafael, CA).
To read the complete report, please go here.


